- Product
- Solutions
Solutions
Unparalleled performance for organizations requiring maximum security, control and efficiencyTailored automated gating pipelines trained on your data, for your useStreamline your data journey with automated uploads, end-to-end traceability, and integrated analysis - Resources
- Support
- Pricing
- Sign In
Guide to Wanderlust and Wishbone
A guide for the two trajectory analysis algorithms, Wanderlust and Wishbone, available in OMIQ.
Background
Wanderlust (Bendall 2014) and Wishbone (Setty 2016) are trajectory inference methods. These types of methods seek to discover a “trajectory” or “pseudotime” relationship among single cell observations in a dataset. The objective is to order the cells along a trajectory so that a researcher may better understand cellular development patterns. The key assumption is that the dataset being analyzed, in total, captures a snapshot of the full cellular development spectrum being studied. It is then up to the algorithm to assign an order to the cells present.
For further background on the theory and practice of trajectory analysis, refer to the aforementioned papers or the impressive review “A comparison of single-cell trajectory inference methods” (Saelens 2019).
Why are Wanderlust and Wishbone Grouped Together?
Wanderlust and Wishbone were reported separately at different times and with different codebases. However, a number of key researchers were involved in the development of both of these methods and they share strong similarities, so much so that the codebase of Wishbone includes the functionality for Wanderlust as an operational mode. The Wishbone codebase is what OMIQ uses to offer both of these methods, with the presumption being that Wanderlust is faithfully implemented. Given the conceptual coupling and literal coupling of these methods, it’s natural to continue the coupling in the documentation.
These Methods Should Not Be Used Casually
This headline is only here to underscore points made in the rest of this document. I.e., both of these methods require somewhat careful thinking in order to execute properly and appropriately. Make sure to understand the assumptions of these methods and to review your results.
Furthermore, these algorithms have limited performance capabilities. The size of dataset they can handle is fairly small (e.g., hundreds of thousands of cells). Keep your analyses subsampled appropriately with this in mind. Furthermore, consider that the story you may tell with these algorithms probably doesn’t require a very large number of cells in the first place.
Important Assumptions Before Using These Methods
Before using Wanderlust or Wishbone you must understand critical assumptions that the methods make. These assumptions impact which data you might try to use with these methods and the care you take in analyzing the results.
The most important consideration for these methods is with respect to branching or lack thereof in the input data. For more information about different types of branching pattern assumptions among trajectory inference methods, please refer to the review article mentioned above.
Wanderlust assumes a linear trajectory. Meaning, regardless of the input data, the result will be a single linear pseudotime progression. This might not be an appropriate model for your input data. Consider, for example, that you used bone marrow stained for all major cell subsets as input to the algorithm. This is not appropriate because such a dataset would contain developmental information that should not all be modeled as a single linear progression. In brief, Wanderlust should only be used when the input data are meant to be aligned to a linear, non-branching trajectory. Note that it’s acceptable to gate/filter input data as necessary to achieve this requirement. Then, individual filtered subsets can be sent through the algorithm and analyzed on their own.
Wishbone assumes a linear trajectory that eventually encounters a single bifurcating branch point that results in two unique developmental paths (which is what gives the algorithm its name). Wishbone should only be used when the input data are meant to be aligned to a linear trajectory that eventually splits into exactly two developmental paths.
Using input data that do not meet the branching or non-branching requirement may still produce a result, but the result may be misleading or nonsensical. For example, if Wishbone is used on a linear developmental pathway, the algorithm will still try to split it and represent the results that way. Same goes for trifurcation instead of bifurcation. Vice versa, if Wanderlust is used on data that have a branching trajectory, it will force the data into a linear trajectory. How these situations can confound data analysis should be clear. The key is that algorithms have assumptions that need to be minded.
For these reasons, it should be noted that these algorithms are somewhat limited in the scope of their application, and that they are better suited for helping to visualize or understand cellular systems for which there is already sufficient prior knowledge. In the absence of this, care should be taken in the interpretation and validation of results.
Wishbone Tutorial
The steps below walk through a complete Wishbone analysis using example data. Feel free to follow along!
► Watch the Trajectory Interference video series
Download the Example File
The example file is here: https://omiq.ai/docs/files/sample_masscyt-wishbone-demo.fcs
It is mass cytometry data of 25k mouse thymus cells. The data have been cleaned and the number of available markers has been reduced to only the ones relevant for analysis. This file was originally provided by the authors in the Wishbone codebase.
Upload it to OMIQ and start a workflow. Once you do that, you’re ready to go to the next step.
Wishbone Steps
1. Run UMAP
This step isn’t strictly necessary but having an embedding of the data helps illustrate some useful workflows with the Wishbone results.
2. Run Diffusion Maps
Diffusion maps is a dimensionality reduction algorithm used as a preprocessing step before Wishbone. The Wishbone algorithm is meant to be run on these result components. This implementation of diffusion maps is included with the original Wishbone codebase. The purpose of diffusion maps is to project the high-parameter data into a smaller number of components that capture the major structures and trends in the data and serves to denoise it.
3. Run Wishbone
4. Interpret Wishbone Results Part 1 (Scatter Plots)
There are some tricks we can do to immediately start interpreting the Wishbone results with traditional plot types.
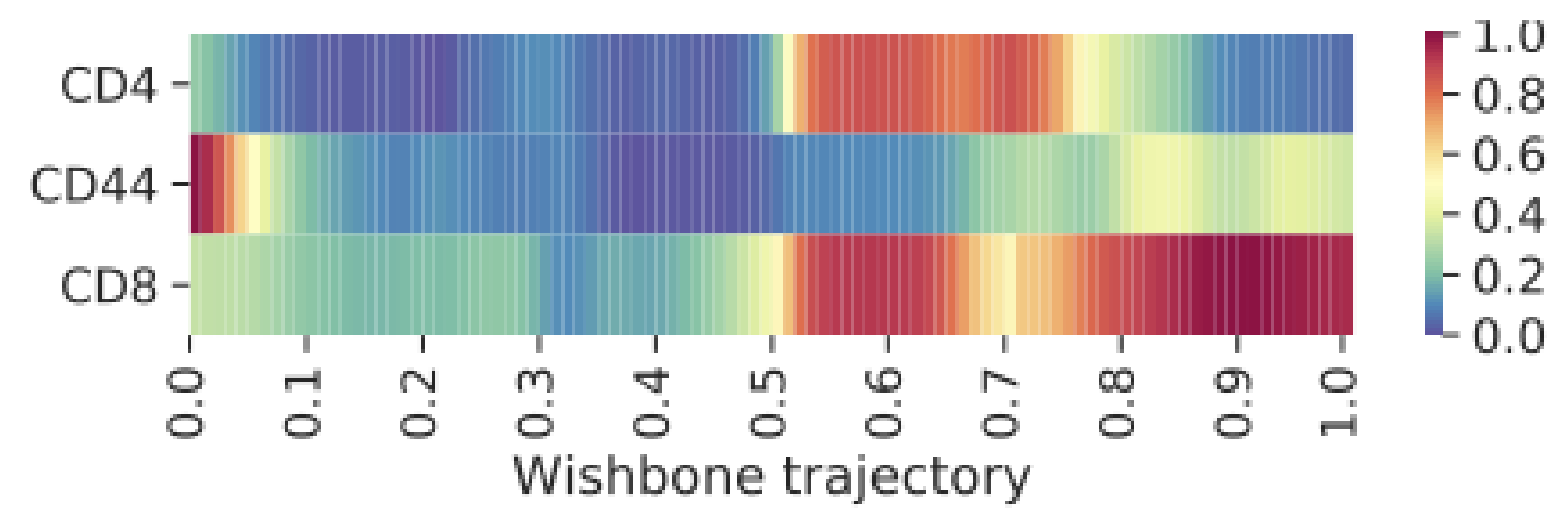
5. Interpret Wishbone Results Part 2 (Trajectory Plots)
“Trajectory plots” are special plot types used for the analysis of trajectory inference results. They include marker overlay line plots, heatmaps, and derivative heatmaps:


The process shown here can be done with Wishbone or Wanderlust results. Technically, any trajectory result can be used as shown in the video, even if it’s from another algorithm. The only limitation is that it must be represented by a column of data and it must be linear or bifurcating. As an advanced topic, think of how you could insert a custom trajectory and visualize it with this tool.
Misc Wishbone Discussion
This section highlights miscellaneous considerations and experience of Omiq staff and other users.
Can original data or other dimension reduction results be used instead of diffusion maps components?
Using diffusion components as input to Wishbone seems important based on the original paper for various reasons discussed there. In our non-exhaustive experience testing this concept it seems as though it is indeed important.
What about using different dimension reduction techniques, such as UMAP? We have tried running Wishbone on different numbers of UMAP components but the results did not align nicely with expectations, despite the UMAP itself being satisfying in how it displays the trajectory information. Tweaks to the UMAP and Wishbone settings can improve the outcome but not to the point of producing a result as successfully as diffusion components. We have not experimented with other techniques.
More discussion on the number of diffusion components for Wishbone
The heuristic for selection of diffusion components to run Wishbone on is covered in the tutorial based on advice from the original authors. It should be noted that some users have reported non-optimal results using this heuristic. We have noted that the cases where this has happened involved selecting more than three components, but that reducing the selection down to three components produced a good result in these cases. Thus if you get a bad result using more than three diffusion components, consider using three instead.
Wanderlust Tutorial
A specific Wanderlust tutorial isn’t offered at this time because the configuration and analysis process is highly similar to Wishbone. If you follow the Wishbone tutorial you will be able to do Wanderlust.
Key differences:
- The Wishbone example file has bifurcating development. Thus it is not appropriate for use with Wanderlust. If you do not have your own linear development dataset but still want to practice with Wanderlust, consider executing the Wishbone tutorial then gating out one of the developmental branches such that the remaining data represent linear development. You could selectively gate using the UMAP result or using the Wishbone branch results (just gate everything except branch value = 3, for example).
- Wanderlust does not produce a branch column. It only produces a trajectory column. The results interpretation is still the same as Wishbone but becomes simplified due to lack of branching.
- Unlike Wishbone, Wanderlust was not described for use with diffusion maps. Thus, by the literature, you can skip the diffusion maps step. Instead, simply provide the original data to the Wanderlust algorithm instead of the diffusion components. Note that using diffusion maps may be useful for Wanderlust but we have not tried this. Let us know if you explore the idea.
Recommended Resources
OMIQ Support Center
Find the answers to frequently asked questions or contact support.
Two Window Analysis in OMIQ
Learn how to access your workflow from two separate windows simultaneously.
Sharing, Collaboration and Groups
Learn how to share your datasets and workflows, set roles and permissions, and create groups.
How to Register an Account
Instructions on how to register your account so you can get started using OMIQ.
More OMIQ Resources

VIDEO SERIESGetting Started With OMIQ
Master the basics of OMIQ with this short video series covering the interface, metadata, feature names and the OMIQ workflow.

GUIDEUnderstanding Data Scaling
A guide to understanding the principles and practice of data scaling.

VIDEO SERIESStatistical Differential Analysis in OMIQ
This in-depth video series teaches how to perform and interpret statistical differential analysis in OMIQ using SAM.

VIDEO SERIESTrajectory Interference in OMIQ
Watch this in-depth video series and learn how to perform and interpret trajectory interference in OMIQ using Wishbone.
Experience the future of flow cytometry.
